
Android Simple Bar Chart Tutorial

Displaying the analysis data using the list of text in the application is very confusing to the user. How can we make our data displaying with more user-friendly? We can display all the data by graphical representation to minimize and summarizes the complexity of data. It is the visual display of data using plots and charts. It is used in many academic and professional disciplines but most widely so in the fields of mathematics, medicine, and the sciences. In this tutorial, I will tell you on how to create an android simple bar chart in the new project.
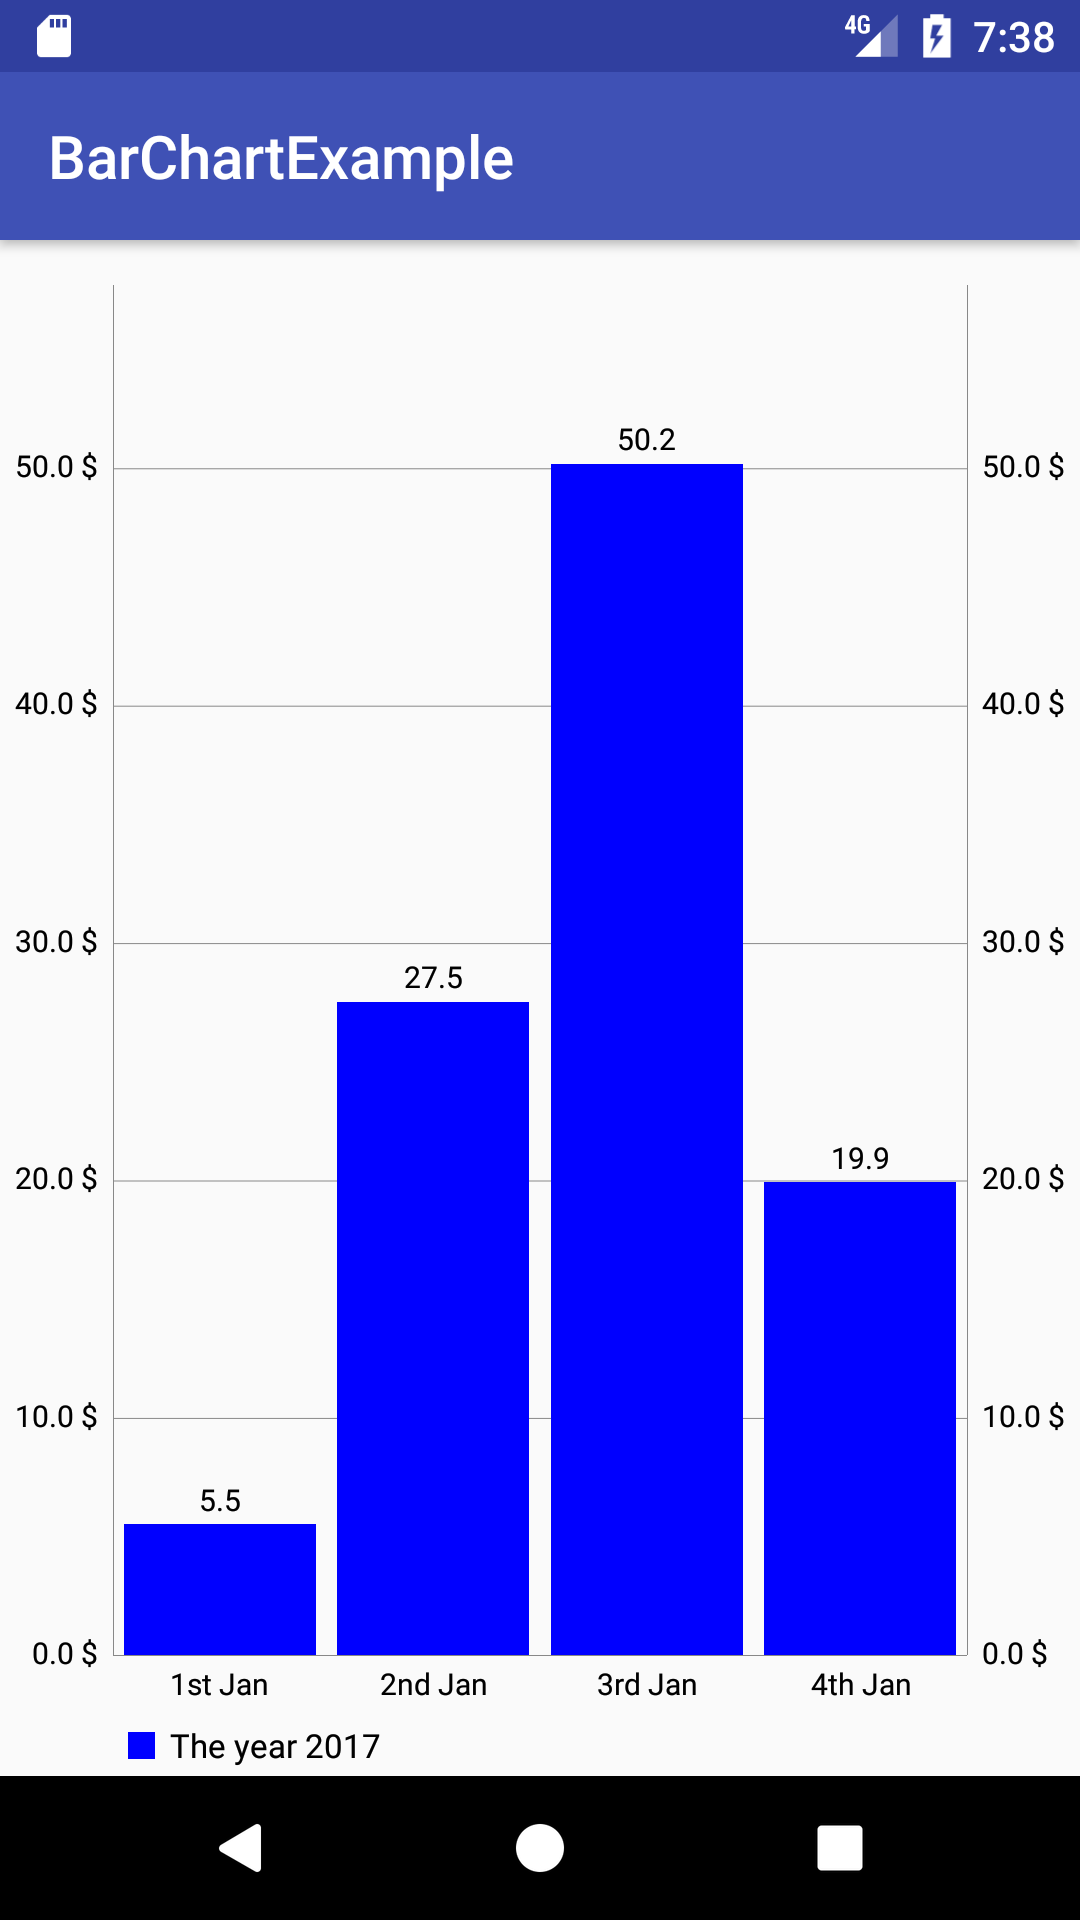
Sample Screenshot
Creating a New Project
1. Open Android Studio IDE in your computer.
2. Create a new project and Edit the Application name to “BarChartExample”.
(Optional) You can edit the company domain or select the suitable location for current project tutorial. Then click next button to proceed.
3. Select Minimum SDK (API 15:Android 4.0.3 (IceCreamSandwich). I choose the API 15 because many android devices currently are support more than API 15. Click Next button.
4. Choose “Empty Activity” and Click Next button
5. Lastly, press finish button.
Add a new dependency
In your module gradle file add a new dependency “MPAndroidChart”. I use this library for creating a bar chart on android.
compile 'com.github.PhilJay:MPAndroidChart:v3.0.2'
Create a new class
Right click the package name and create a new class “DayAxisValueFormatter” to Formatting Day.
import com.github.mikephil.charting.charts.BarLineChartBase;
import com.github.mikephil.charting.components.AxisBase;
import com.github.mikephil.charting.formatter.IAxisValueFormatter;


public class DayAxisValueFormatter implements IAxisValueFormatter
{

    protected String[] mMonths = new String[]{
            "Jan", "Feb", "Mar", "Apr", "May", "Jun", "Jul", "Aug", "Sep", "Oct", "Nov", "Dec"
    };

    private BarLineChartBase<?> chart;

    public DayAxisValueFormatter(BarLineChartBase<?> chart) {
        this.chart = chart;
    }

    @Override
    public String getFormattedValue(float value, AxisBase axis) {

        int days = (int) value;

        int year = determineYear(days);

        int month = determineMonth(days);
        String monthName = mMonths[month % mMonths.length];
        String yearName = String.valueOf(year);

        if (chart.getVisibleXRange() > 30 * 6) {

            return monthName + " " + yearName;
        } else {

            int dayOfMonth = determineDayOfMonth(days, month + 12 * (year - 2016));

            String appendix = "th";

            switch (dayOfMonth) {
                case 1:
                    appendix = "st";
                    break;
                case 2:
                    appendix = "nd";
                    break;
                case 3:
                    appendix = "rd";
                    break;
                case 21:
                    appendix = "st";
                    break;
                case 22:
                    appendix = "nd";
                    break;
                case 23:
                    appendix = "rd";
                    break;
                case 31:
                    appendix = "st";
                    break;
            }

            return dayOfMonth == 0 ? "" : dayOfMonth + appendix + " " + monthName;
        }
    }

    private int getDaysForMonth(int month, int year) {

        // month is 0-based

        if (month == 1) {
            boolean is29Feb = false;

            if (year < 1582)
                is29Feb = (year < 1 ? year + 1 : year) % 4 == 0;
            else if (year > 1582)
                is29Feb = year % 4 == 0 && (year % 100 != 0 || year % 400 == 0);

            return is29Feb ? 29 : 28;
        }

        if (month == 3 || month == 5 || month == 8 || month == 10)
            return 30;
        else
            return 31;
    }

    private int determineMonth(int dayOfYear) {

        int month = -1;
        int days = 0;

        while (days < dayOfYear) {
            month = month + 1;

            if (month >= 12)
                month = 0;

            int year = determineYear(days);
            days += getDaysForMonth(month, year);
        }

        return Math.max(month, 0);
    }

    private int determineDayOfMonth(int days, int month) {

        int count = 0;
        int daysForMonths = 0;

        while (count < month) {

            int year = determineYear(daysForMonths);
            daysForMonths += getDaysForMonth(count % 12, year);
            count++;
        }

        return days - daysForMonths;
    }

    private int determineYear(int days) {

        if (days <= 366)
            return 2016;
        else if (days <= 730)
            return 2017;
        else if (days <= 1094)
            return 2018;
        else if (days <= 1458)
            return 2019;
        else
            return 2020;

    }
}
Create another new class
Create a new class “MyAxisValueFormatter” to formatting the currency how its display. It should implement the IAxisValueFortter interface in this class.
import com.github.mikephil.charting.components.AxisBase;
import com.github.mikephil.charting.formatter.IAxisValueFormatter;

import java.text.DecimalFormat;

public class MyAxisValueFormatter implements IAxisValueFormatter
{

    private DecimalFormat mFormat;

    public MyAxisValueFormatter() {
        mFormat = new DecimalFormat("###,###,###,##0.0");
    }

    @Override
    public String getFormattedValue(float value, AxisBase axis) {
        return mFormat.format(value) + " $";
    }
}
Create a new custom MarkerView class
After that, create another new class to custom MarkerView in your chart.
public class XYMarkerView extends MarkerView {

    private TextView tvContent;
    private IAxisValueFormatter xAxisValueFormatter;

    private DecimalFormat format;

    public XYMarkerView(Context context, IAxisValueFormatter xAxisValueFormatter) {
        super(context, R.layout.custom_marker_view);

        this.xAxisValueFormatter = xAxisValueFormatter;
        tvContent = (TextView) findViewById(R.id.tvContent);
        format = new DecimalFormat("###.0");
    }

    // callbacks everytime the MarkerView is redrawn, can be used to update the
    // content (user-interface)
    @Override
    public void refreshContent(Entry e, Highlight highlight) {

        tvContent.setText("x: " + xAxisValueFormatter.getFormattedValue(e.getX(), null) + ", y: " + format.format(e.getY()));

        super.refreshContent(e, highlight);
    }

    @Override
    public MPPointF getOffset() {
        return new MPPointF(-(getWidth() / 2), -getHeight());
    }
}
Add a new custom layout for MarkerView
Create a new xml layout in your layout folder and name it “custom_marker_view.xml”. Remember to add an image in your drawable so that you can use that image for your custom marker.
<?xml version="1.0" encoding="utf-8"?>
<RelativeLayout xmlns:android="http://schemas.android.com/apk/res/android"
    android:layout_width="wrap_content"
    android:layout_height="40dp"
    android:background="@drawable/marker2" >

    <TextView
        android:id="@+id/tvContent"
        android:layout_width="wrap_content"
        android:layout_height="wrap_content"
        android:layout_centerHorizontal="true"
        android:layout_marginTop="7dp"
        android:layout_marginLeft="5dp"
        android:layout_marginRight="5dp"
        android:text=""
        android:textSize="12dp"
        android:textColor="@android:color/white"
        android:ellipsize="end"
        android:singleLine="true"
        android:textAppearance="?android:attr/textAppearanceSmall" />

</RelativeLayout>
Edit activity_main.xml layout
Go to the activity_main layout and add BarChart inside this layout.
<?xml version="1.0" encoding="utf-8"?>
<RelativeLayout xmlns:android="http://schemas.android.com/apk/res/android"
    android:layout_width="match_parent"
    android:layout_height="match_parent" >

    <com.github.mikephil.charting.charts.BarChart
        android:id="@+id/chart1"
        android:layout_width="match_parent"
        android:layout_height="match_parent"
        />

</RelativeLayout>
Edit MainActivity.class java
Open this class and it will initialise the bar chart in your activity. You can follow the source code below.
import com.github.mikephil.charting.charts.BarChart;
import com.github.mikephil.charting.components.Legend;
import com.github.mikephil.charting.components.XAxis;
import com.github.mikephil.charting.components.YAxis;
import com.github.mikephil.charting.data.BarData;
import com.github.mikephil.charting.data.BarDataSet;
import com.github.mikephil.charting.data.BarEntry;
import com.github.mikephil.charting.data.Entry;
import com.github.mikephil.charting.formatter.IAxisValueFormatter;
import com.github.mikephil.charting.highlight.Highlight;
import com.github.mikephil.charting.interfaces.datasets.IBarDataSet;
import com.github.mikephil.charting.listener.OnChartValueSelectedListener;
import com.github.mikephil.charting.utils.MPPointF;


import java.util.ArrayList;
import java.util.List;

public class MainActivity extends AppCompatActivity implements
        OnChartValueSelectedListener {

    protected BarChart mChart;

    @Override
    protected void onCreate(Bundle savedInstanceState) {
        super.onCreate(savedInstanceState);

        setContentView(R.layout.activity_main);

        mChart = (BarChart) findViewById(R.id.chart1);
        mChart.setOnChartValueSelectedListener(this);

        mChart.setDrawBarShadow(false);
        mChart.setDrawValueAboveBar(true);

        mChart.getDescription().setEnabled(false);

        // if more than 60 entries are displayed in the chart, no values will be
        // drawn
        mChart.setMaxVisibleValueCount(60);

        // scaling can now only be done on x- and y-axis separately
        mChart.setPinchZoom(false);

        mChart.setDrawGridBackground(false);
        // mChart.setDrawYLabels(false);

        IAxisValueFormatter xAxisFormatter = new DayAxisValueFormatter(mChart);

        XAxis xAxis = mChart.getXAxis();
        xAxis.setPosition(XAxis.XAxisPosition.BOTTOM);
       // xAxis.setTypeface(mTfLight);
        xAxis.setDrawGridLines(false);
        xAxis.setGranularity(1f); // only intervals of 1 day
        xAxis.setLabelCount(7);
        xAxis.setValueFormatter(xAxisFormatter);

        IAxisValueFormatter custom = new MyAxisValueFormatter();

        YAxis leftAxis = mChart.getAxisLeft();
        //leftAxis.setTypeface(mTfLight);
        leftAxis.setLabelCount(8, false);
        leftAxis.setValueFormatter(custom);
        leftAxis.setPosition(YAxis.YAxisLabelPosition.OUTSIDE_CHART);
        leftAxis.setSpaceTop(15f);
        leftAxis.setAxisMinimum(0f); // this replaces setStartAtZero(true)

        YAxis rightAxis = mChart.getAxisRight();
        rightAxis.setDrawGridLines(false);
       // rightAxis.setTypeface(mTfLight);
        rightAxis.setLabelCount(8, false);
        rightAxis.setValueFormatter(custom);
        rightAxis.setSpaceTop(15f);
        rightAxis.setAxisMinimum(0f); // this replaces setStartAtZero(true)

        Legend l = mChart.getLegend();
        l.setVerticalAlignment(Legend.LegendVerticalAlignment.BOTTOM);
        l.setHorizontalAlignment(Legend.LegendHorizontalAlignment.LEFT);
        l.setOrientation(Legend.LegendOrientation.HORIZONTAL);
        l.setDrawInside(false);
        l.setForm(Legend.LegendForm.SQUARE);
        l.setFormSize(9f);
        l.setTextSize(11f);
        l.setXEntrySpace(4f);


        XYMarkerView mv = new XYMarkerView(this, xAxisFormatter);
        mv.setChartView(mChart); // For bounds control
        mChart.setMarker(mv); // Set the marker to the chart

        setData(3, 50);


        // mChart.setDrawLegend(false);
    }


    private void setData(int count, float range) {

        float start = 1f;

        ArrayList<BarEntry> yVals1 = new ArrayList<BarEntry>();

        for (int i = (int) start; i < start + count + 1; i++) {
            float mult = (range + 1);
            float val = (float) (Math.random() * mult);

            if (Math.random() * 100 < 25) {
                yVals1.add(new BarEntry(i, val, getResources().getDrawable(R.mipmap.ic_launcher)));
            } else {
                yVals1.add(new BarEntry(i, val));
            }
        }

        BarDataSet set1;

        if (mChart.getData() != null &&
                mChart.getData().getDataSetCount() > 0) {
            set1 = (BarDataSet) mChart.getData().getDataSetByIndex(0);
            set1.setValues(yVals1);
            mChart.getData().notifyDataChanged();
            mChart.notifyDataSetChanged();
        } else {
            set1 = new BarDataSet(yVals1, "The year 2017");

            set1.setDrawIcons(false);

        //    set1.setColors(ColorTemplate.MATERIAL_COLORS);
            set1.setColors(Color.BLUE);
            ArrayList<IBarDataSet> dataSets = new ArrayList<IBarDataSet>();
            dataSets.add(set1);

            BarData data = new BarData(dataSets);
            data.setValueTextSize(10f);
          //  data.setValueTypeface(mTfLight);
            data.setBarWidth(0.9f);

            mChart.setData(data);
        }
    }

    protected RectF mOnValueSelectedRectF = new RectF();

    @SuppressLint("NewApi")
    @Override
    public void onValueSelected(Entry e, Highlight h) {

        if (e == null)
            return;

        RectF bounds = mOnValueSelectedRectF;
        mChart.getBarBounds((BarEntry) e, bounds);
        MPPointF position = mChart.getPosition(e, YAxis.AxisDependency.LEFT);

        Log.i("bounds", bounds.toString());
        Log.i("position", position.toString());

        Log.i("x-index",
                "low: " + mChart.getLowestVisibleX() + ", high: "
                        + mChart.getHighestVisibleX());

        MPPointF.recycleInstance(position);
    }

    @Override
    public void onNothingSelected() { }
}
Run Your Project
In conclusion, now you can run this project in your android emulator to check how the bar chart been populated in the activity.


Thank you for the post, please how do i display last 3 or six months at the bottom of the chart, like Sep, Oct, Nov, Jan, Feb